LPR Speed Control: Report
This page comprises the Report item overview and functionality description. The item allows viewing average speed statistics from the selected rule.
Overview
To access speed statistics, in the LPR plugin menu:
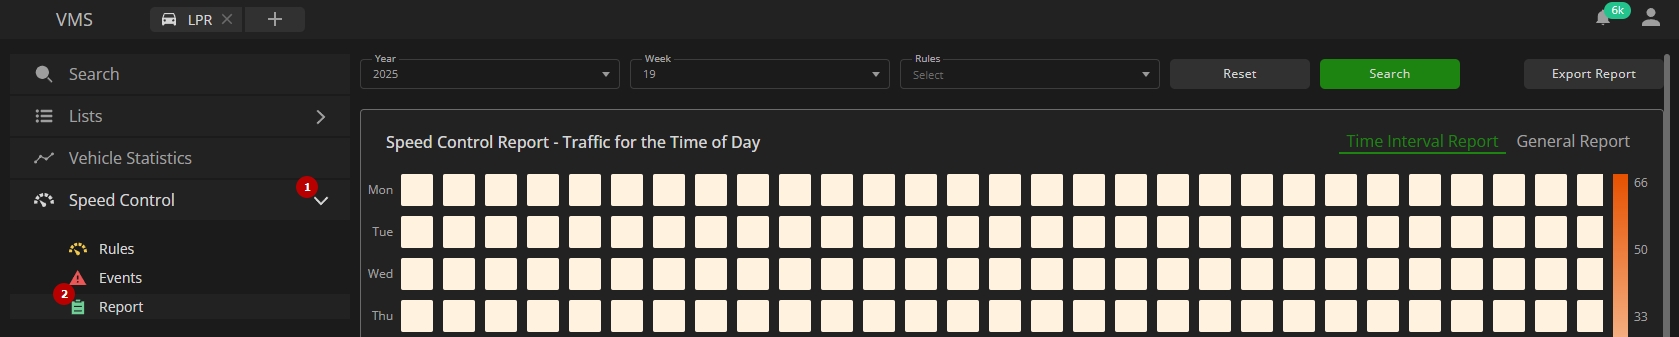
- Expand the Speed Control section
- Select the Report item
Use and Functionality
The Report tab functional menu comprises:
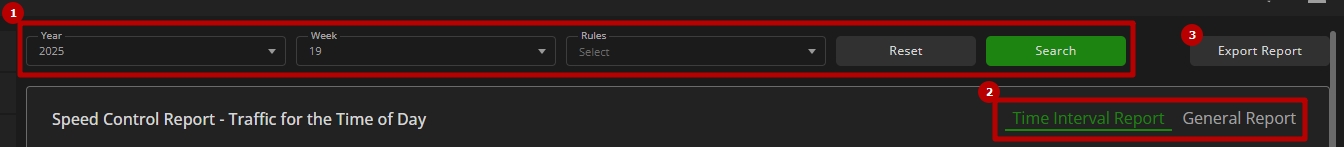
- Filters to:
- Select the required year and week
- Set the desired time frames
- Select multiple rules from the drop-down list
- Click the Search button to start filtering
- Click the Reset button to clear the filters
- Tabs to display statistics in:
- Time Interval Report
- General Report
- Export Report option to download the speed report in the CSV format
- The Time Frame filter is enabled only for the General Report tab.
- The Export Report option is available only for the Time Interval Report tab.
Time Interval Report Tab
The Time Interval Report shows:
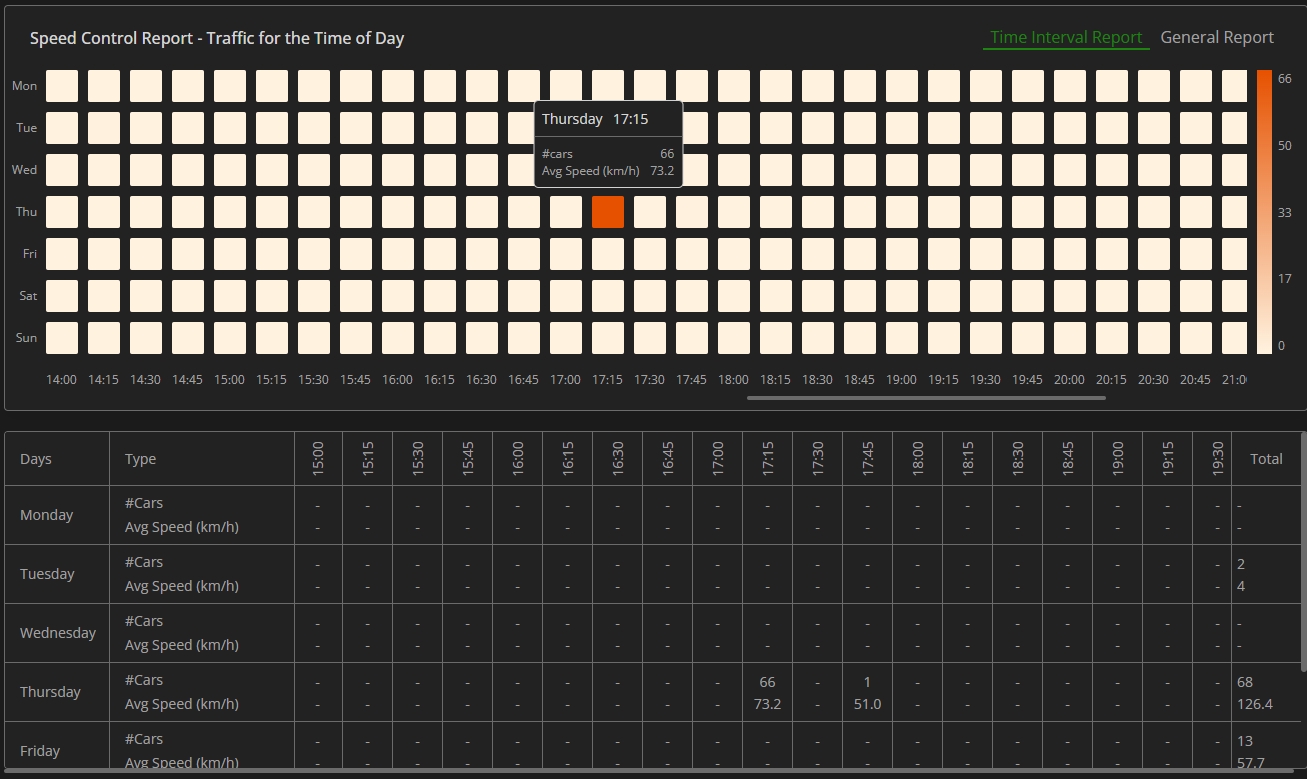
- Table chart with the number of vehicles and average speed by 15 minutes time intervals and days of a week
- Table with columns by 15 minutes time intervals and rows by days of the week, number of vehicles, and average speed
General Report Tab
The General Report allows to:
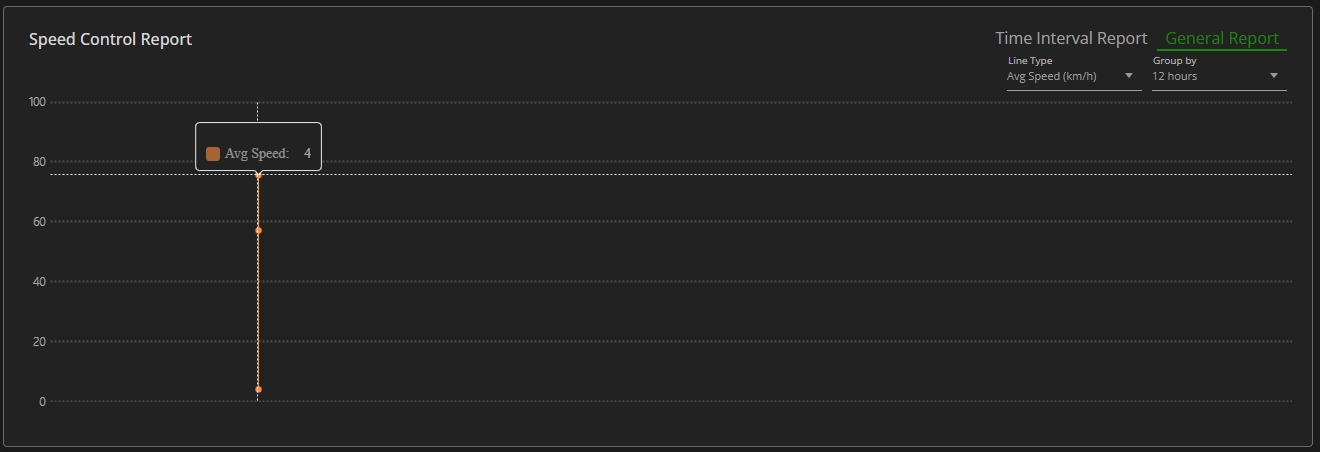
- Select the Line Type parameter from a drop-down list that the curve displays on the graph:
- Average speed (km/h)
- Average speed (mi/h)
- Cars quantity
- Select the desired time intervals from a Group By drop-down list to set the intervals between the graph breakpoints
- Hover the mouse over the desired breakpoint on the graph to view the specific statistics data