LPR Tab: Vehicle Statistics
This page comprises the Vehicle Statistics section overview and functionality description. The section allows viewing detected vehicle statistics from the selected analytics.
Overview
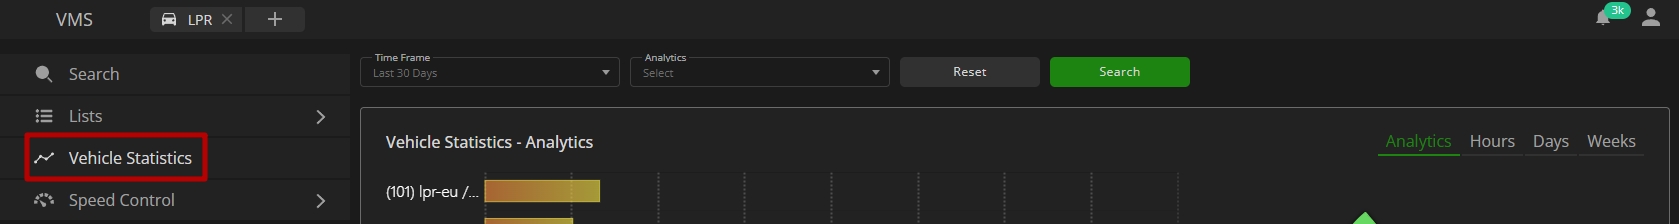
To access vehicle statistics, select the Vehicle Statistics section in the LPR plugin menu:
Use and Functionality
The Vehicle Statistics functional menu comprises:
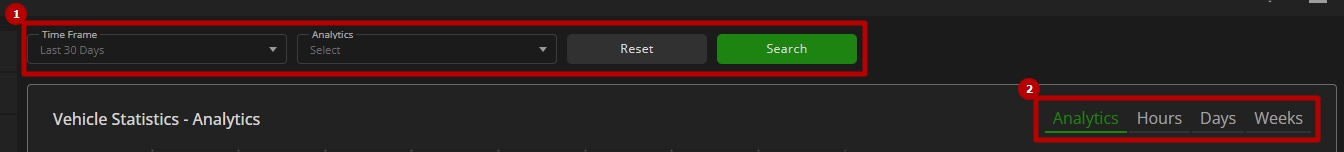
- Filters to:
- Select the desired time frame to produce statistics
- Click the Analytics parameter to choose the desired video analytics. In the pop-up window:
- Check the boxes next to the required video analytics and groups
- Click the Confirm button
- Click the Search button to start filtering
- Click the Reset button to clear the filters
- Tabs for sorting statistics data by:
- Analytics
- Hours
- Days
- Weeks
The Vehicle Statistics section opens with the Analytics tab by default.
Analytics Tab
The Analytics tab shows:
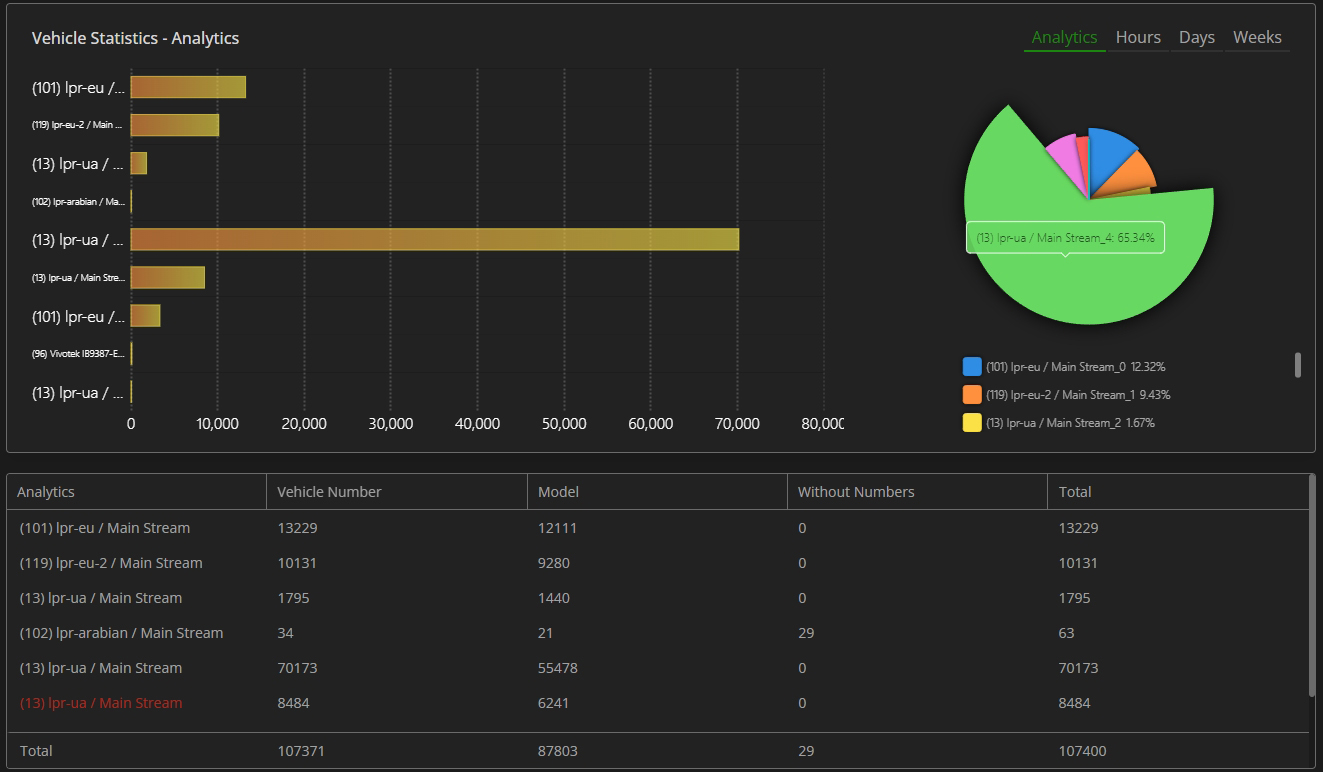
- Rectangular bars on the bar chart with lengths proportional to the vehicle quantity detected by selected analytics
- Slices on the donut chart with the amount of the found by selected analytics vehicles in percentage
- Table columns displaying data by selected analytics, including:
- Detected vehicles with recognized license plates
- Detected vehicles with recognized make and model
- Detected vehicles without a recognized license plate
- Total number of detected vehicles
- A red analytics name in the table indicates that the analytics has been deleted.
- The Total row at the bottom of the table displays the overall count of detected vehicles for each column.
- Hovering over the donut chart slices reveals the percentage of total detections contributed by each analytics.
Hours Tab
The Hours tab shows:
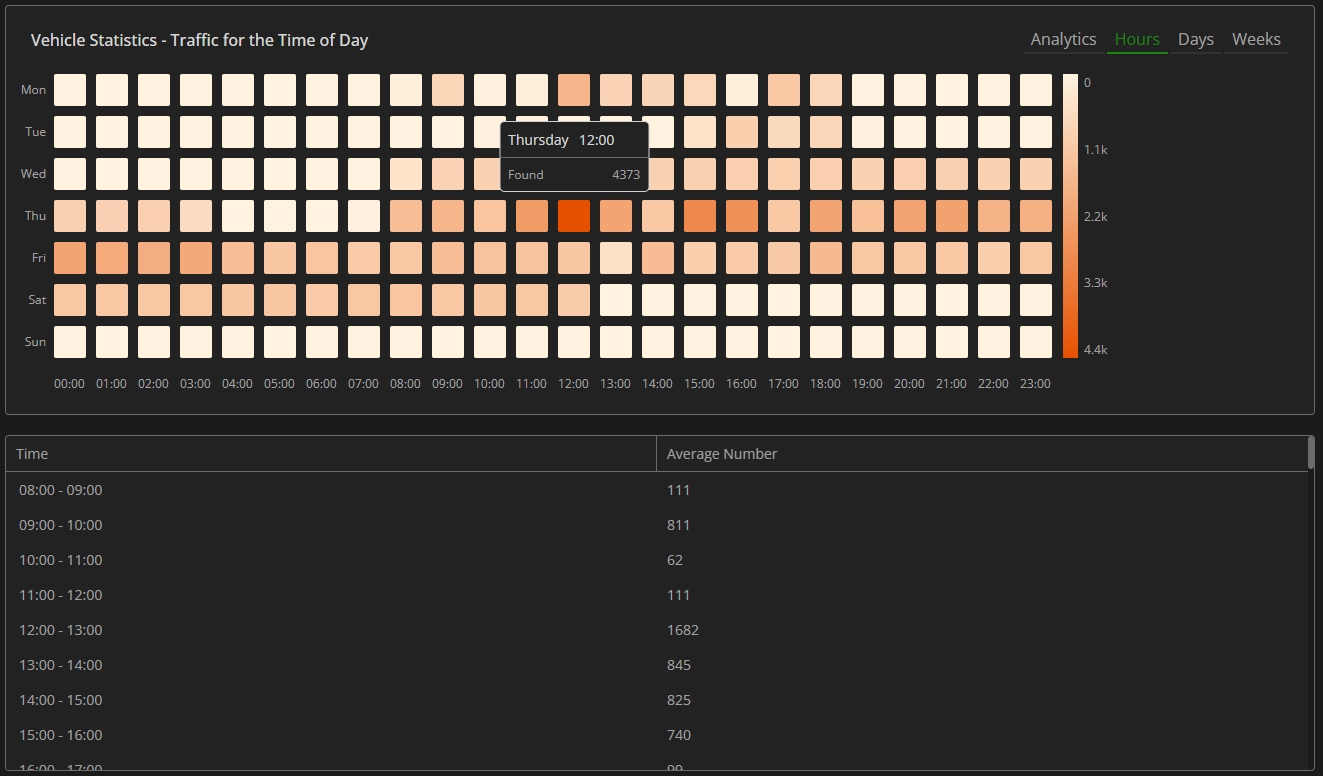
- Table chart with the number of detected vehicles by hours and days of a week
- Table with average number of vehicles detected during specific time intervals
Hovering over the colored squares reveals the found vehicle quantity for the required time interval.
Days Tab
The Days tab shows:
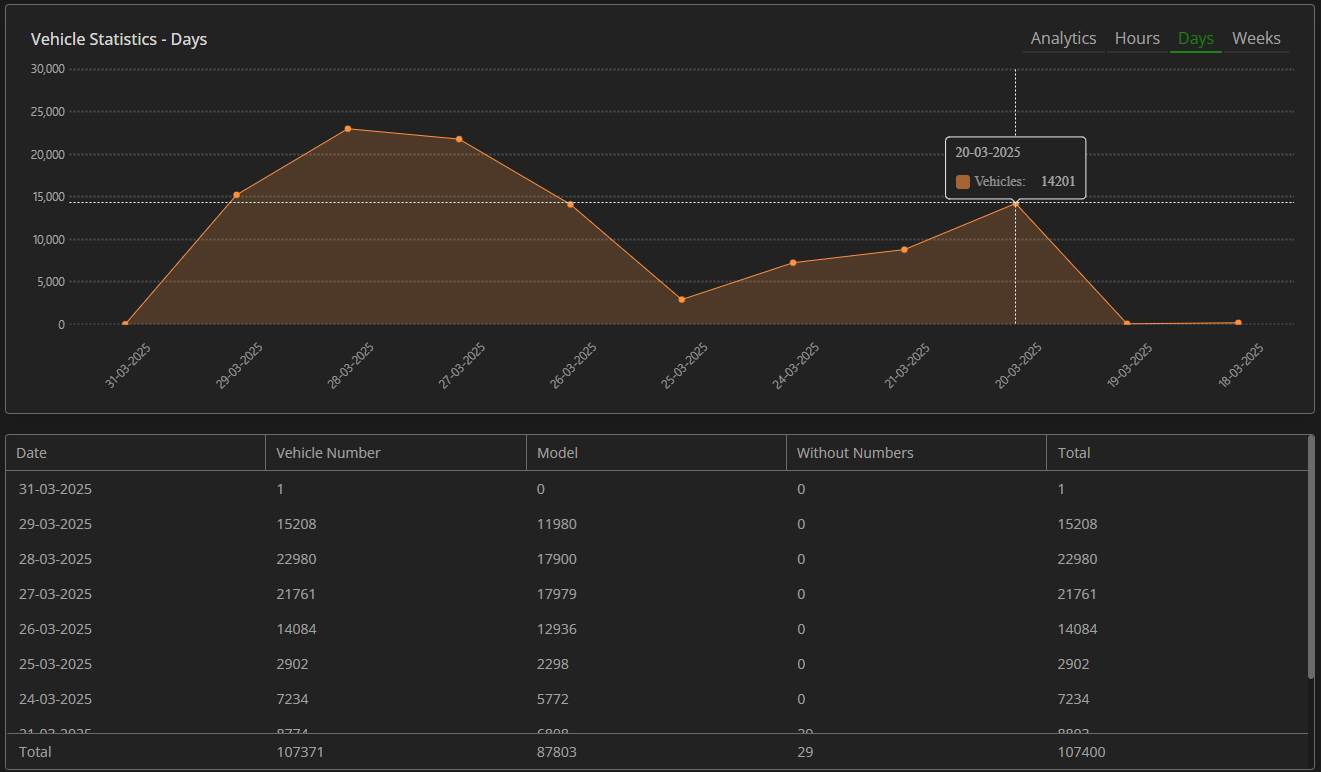
- Checkpoints on the area chart by vehicle quantity detected during the required date
- Table columns displaying data by date, including:
- Detected vehicles with recognized license plates
- Detected vehicles with recognized make and model
- Detected vehicles without a recognized license plate
- Total number of detected vehicles
Hovering over the checkpoints reveals the found vehicle quantity for a required date.
Weeks Tab
The Weeks tab shows:
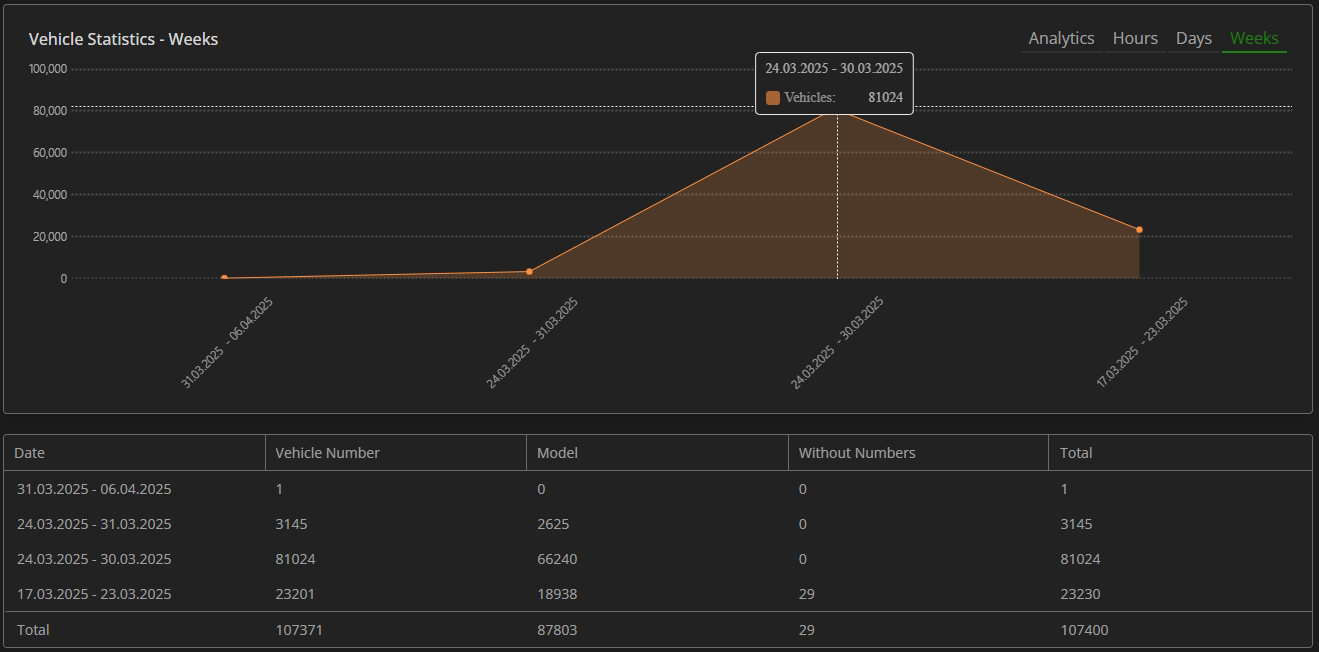
- Checkpoints on the area chart by vehicle quantity detected during the required week
- Table columns displaying data by weeks, including:
- Detected vehicles with recognized license plates
- Detected vehicles with recognized make and model
- Detected vehicles without a recognized license plate
- Total number of detected vehicles
Hovering over the checkpoints reveals the found vehicle quantity for a required week.