LPR Lists: Report
This page comprises the Report item overview and functionality description. The item allows viewing statistics for vehicles from the lists.
Overview
To access vehicle list report, in the LPR plugin menu:
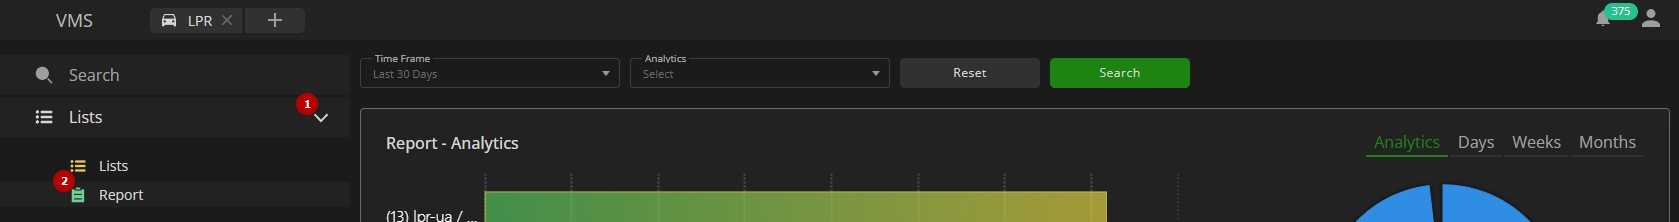
- Expand the Lists section
- Select the Report item
Use and Functionality
The Report functional menu comprises:
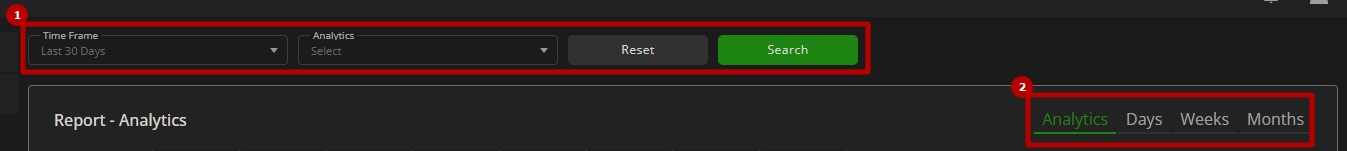
- Filters to:
- Select the desired time frame to produce report
- Click the Analytics parameter to choose the desired video analytics. In the pop-up window:
- Check the boxes next to the required video analytics and groups
- Click the Confirm button
- Click the Search button to start filtering
- Click the Reset button to clear the filters
- Tabs for sorting report data by:
- Analytics
- Days
- Weeks
- Months
The Report item opens with the Analytics tab by default.
Analytics Tab
The Analytics tab shows:
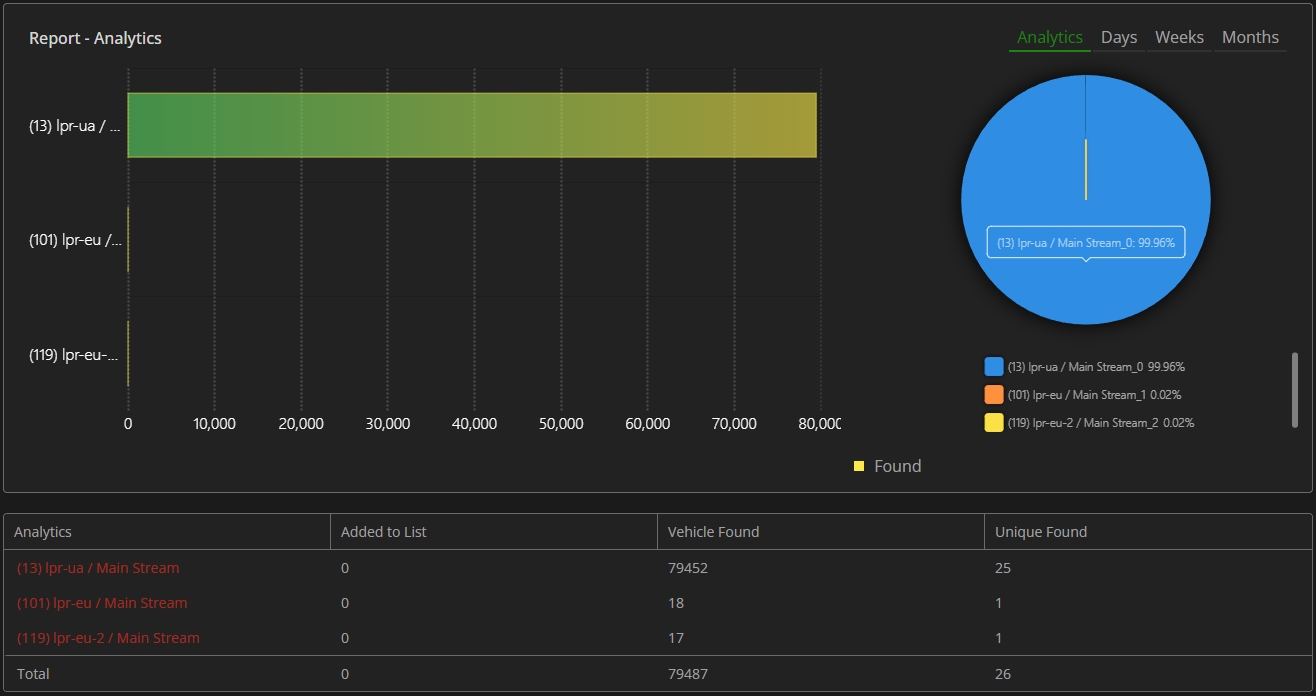
- Rectangular bars on the bar chart with lengths proportional to the vehicles from lists quantity detected by selected analytics
- Slices on the donut chart with the amount of the found vehicles from lists by selected analytics in percentage
- Table columns displaying data by selected analytics, including:
- Vehicles added to list during the selected time frame
- Detected vehicles from lists
- Detected unique vehicles
- A red analytics name in the table indicates that the analytics has been deleted.
- The Total row at the bottom of the table displays the overall count of vehicles for each column.
- Hovering over the donut chart slices reveals the percentage of total detections from lists contributed by each analytics.
- Vehicle Found column counts every time the vehicle from the list is detected by the analytics.
- Unique Found column counts only detected unique vehicles from the list. The unique vehicle is counted only once for the selected time frame.
Days Tab
The Days tab shows:
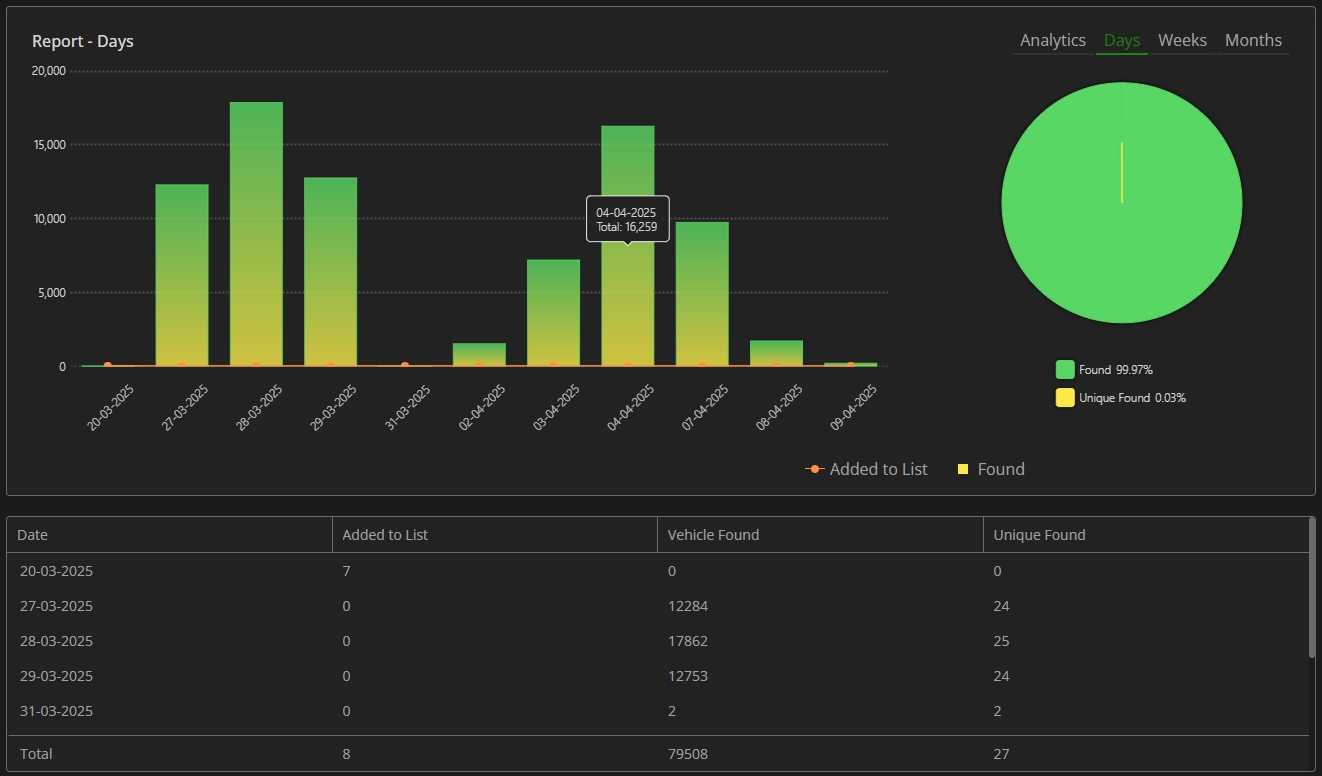
- Columns on the combo chart with heights proportional to the number of vehicles from the lists detected within the required day
- Checkpoints on the combo chart by vehicles quantity added to the list within the required day
- Slices on the donut chart with the amount of the total found and unique vehicles from lists in percentage
- Table columns displaying data by selected dates, including:
- Vehicles added to list during the day
- Detected vehicles from lists
- Detected unique vehicles
- Total row at the bottom of the table displays the overall count of vehicles for each column.
- Vehicle Found column counts every time the vehicle from the list is detected by the analytics.
- Unique Found column counts only detected unique vehicles from the list. The unique vehicle is counted only once for the selected time frame.
Weeks Tab
The Weeks tab shows:
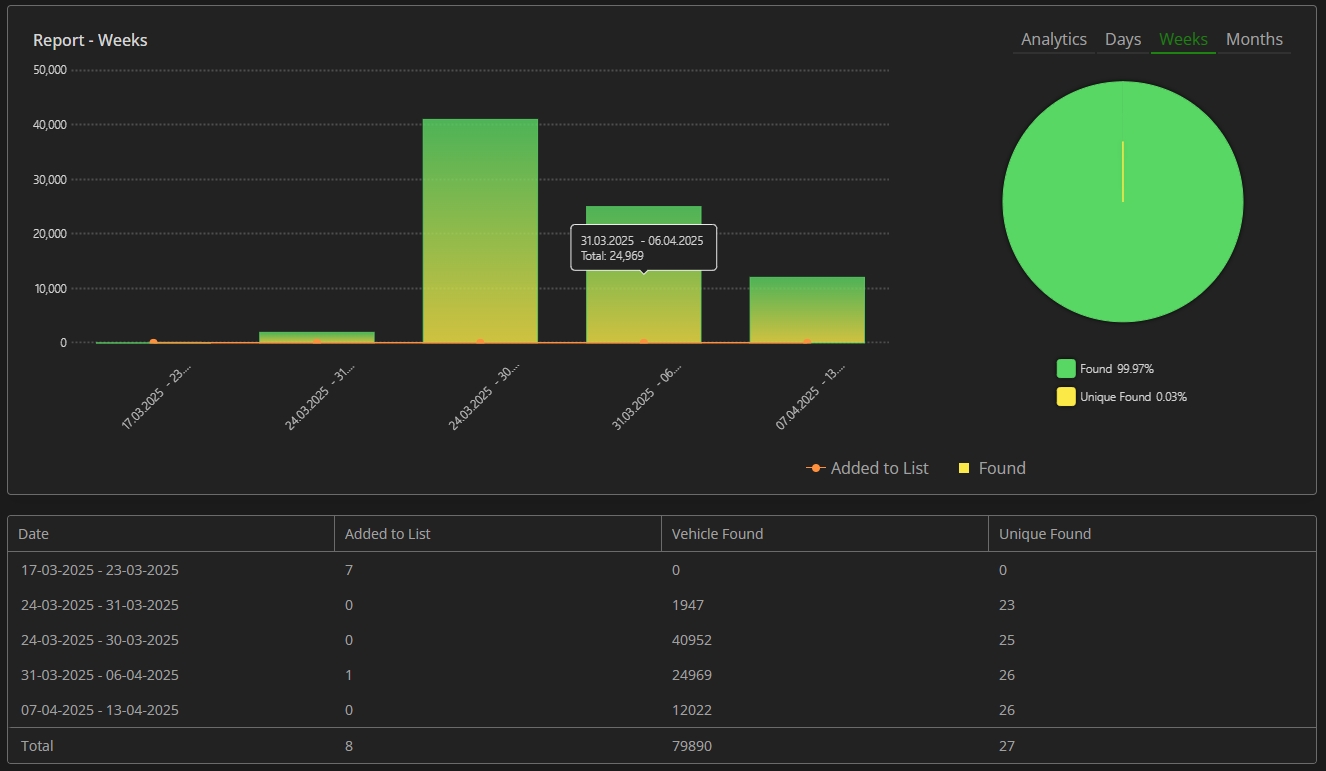
- Columns on the combo chart with heights proportional to the number of vehicles from the lists detected within the required week
- Checkpoints on the combo chart by vehicles quantity added to the list within the required week
- Slices on the donut chart with the amount of the total found and unique vehicles from lists in percentage
- Table columns displaying data by selected weeks, including:
- Vehicles added to list during the week
- Detected vehicles from lists
- Detected unique vehicles
- Total row at the bottom of the table displays the overall count of vehicles for each column.
- Vehicle Found column counts every time the vehicle from the list is detected by the analytics.
- Unique Found column counts only detected unique vehicles from the list. The unique vehicle is counted only once for the selected time frame.
Months Tab
The Months tab shows:
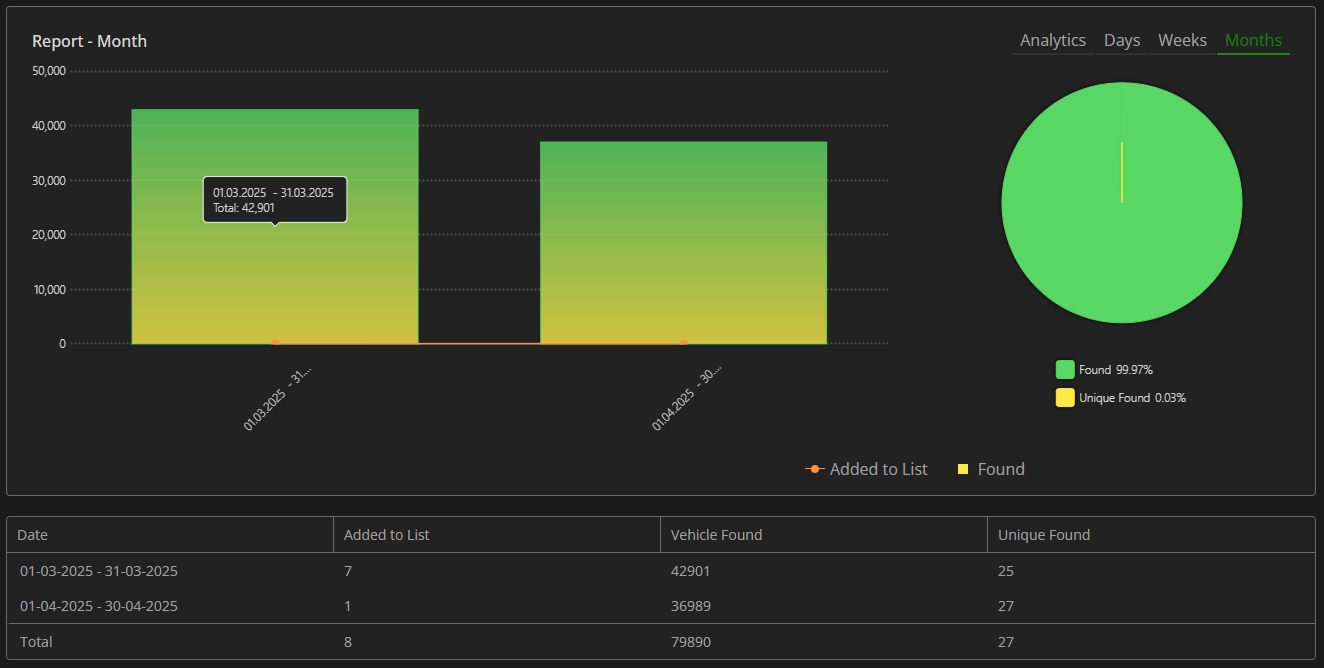
- Columns on the combo chart with heights proportional to the number of vehicles from the lists detected within the required month
- Checkpoints on the combo chart by vehicles quantity added to the list within the required month
- Slices on the donut chart with the amount of the total found and unique vehicles from lists in percentage
- Table columns displaying data by selected dates, including:
- Vehicles added to list during the month
- Detected vehicles from lists
- Detected unique vehicles
- Total row at the bottom of the table displays the overall count of vehicles for each column.
- Vehicle Found column counts every time the vehicle from the list is detected by the analytics.
- Unique Found column counts only detected unique vehicles from the list. The unique vehicle is counted only once for the selected time frame.