Monitoring
Overview
To access server monitoring, select the Monitoring item in the main menu:
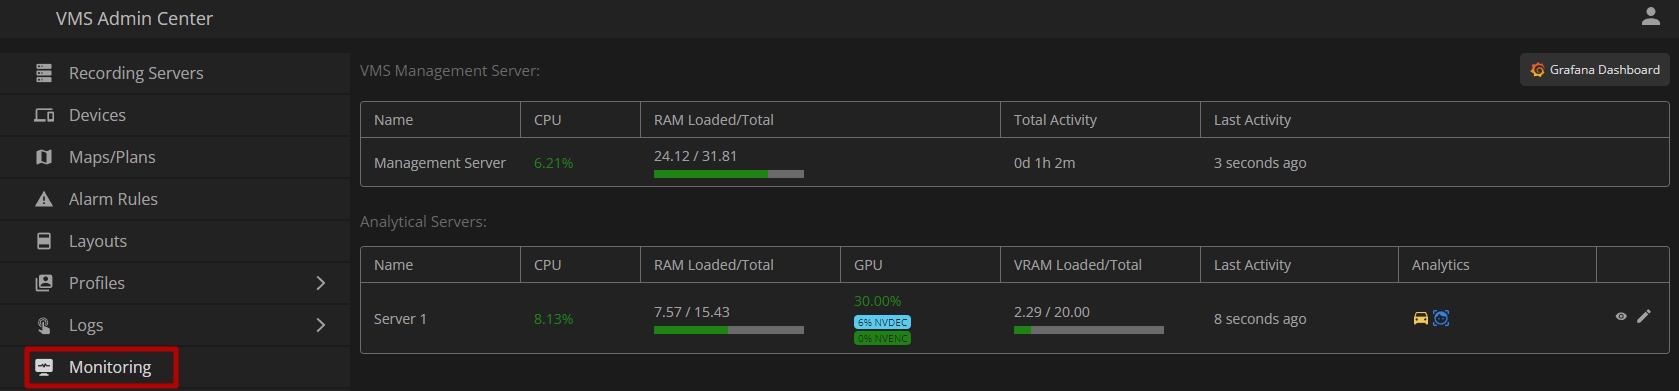
The Monitoring item displays information about the VMS Management Server and allows viewing expanded dashboards in Grafana with system monitoring.
VMS Management Server
The VMS Management Server block shows:
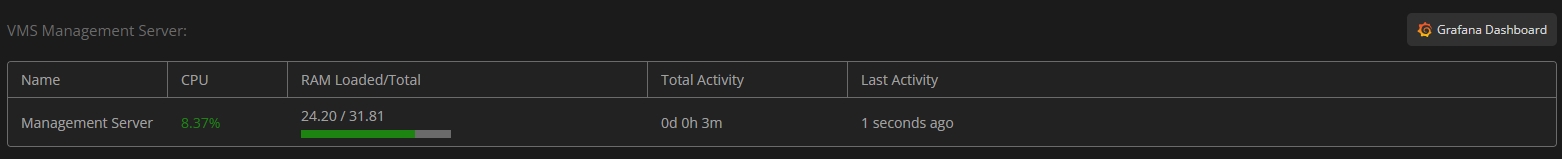
- Server name
- CPU current activity in percentage
- RAM load
- Total management server activity time
- Latest update time of the management server activity
Grafana Dashboard
The Grafana Dashboard is an external monitoring tool integrated with the VMS system to provide detailed insights into system performance. It allows users to monitor various system metrics in real-time and review historical data for system analysis and troubleshooting.
The monitoring solution is built using the following components:
- Grafana: A visualization platform that provides real-time data monitoring and custom dashboards for different system components.
- InfluxDB: A time-series database that stores all collected metrics from the system, ensuring that historical performance data is available.
- Telegraf: A server agent that collects metrics, such as CPU load, disk activity, and network performance, and sends them to InfluxDB for storage and processing.
- This monitoring solution is automatically installed along with the VMS Management Server, ensuring that performance data is readily available without additional setup.
- Metrics are collected every 10 seconds, ensuring that real-time data is always up-to-date.
- All collected data is retained for 180 days, giving users ample time to review long-term trends and system behavior.
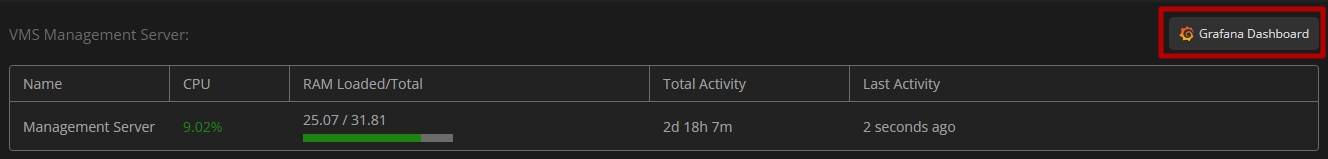
To access the dashboard, click the Grafana Dashboard button located in the upper-right corner of the page:
Users can view dashboards without needing to log in, but authorization is required for editing. To authorize, click the Sign In button in the upper-right corner of the page:

The default login credentials are:
- Username: admin
- Password: admin
To select the desired server's dashboard, select the Dashboards section in the main menu:
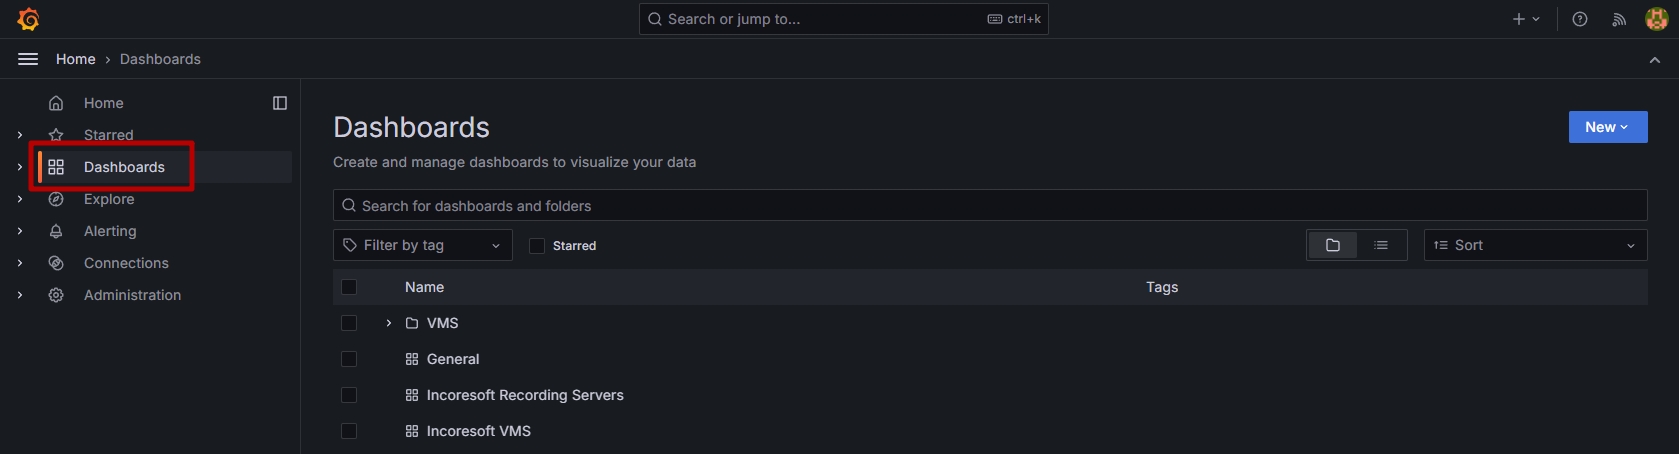
There are specific dashboards for:
- Management Server (VMS-Core): Displays data related to the VMS Management Server.
- Recording Servers: Each recording server has its own dashboard, displaying system metrics for individual servers.
- Analytical Servers: Separate dashboards for each analytical server.
Each dashboard's data is grouped into sections that provide real-time information and historical performance metrics. The key sections of the dashboards include:
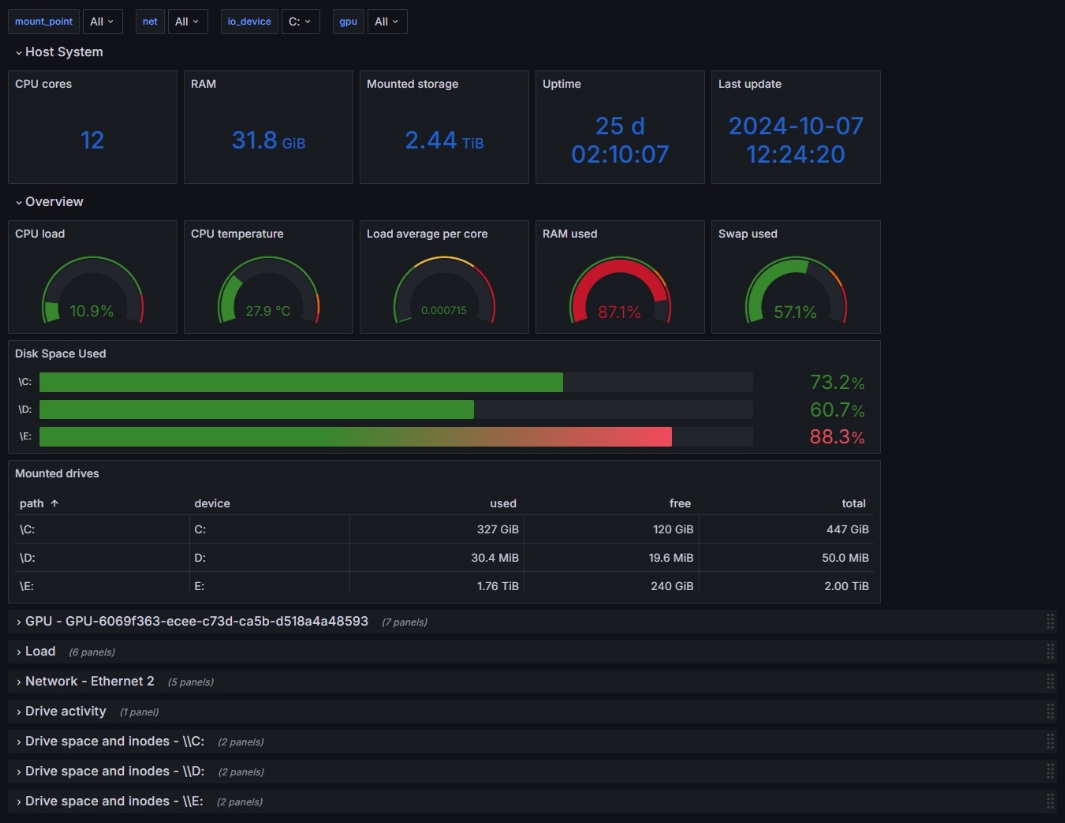
- Host System: Displays key system metrics related to the host’s performance.
- Overview: Highlights the general health of the system with various metrics.
- GPU: Provides information on the GPU’s utilization and performance.
- Load: Breaks down the CPU and system load over time.
- Network: Covers network traffic and bandwidth usage.
- Drive Activity: Visualizes the activity related to the system’s drives.
- Drive Space and Inodes: Provides insight into disk space usage and inode allocation.
- At the top of the dashboards, in the Host System and Overview sections, users can see live data.
- Further down, additional sections show historical data, enabling users to review system behavior over time.
In addition to performance monitoring, Grafana also features an integrated alert system. To access alerts, select the Alerting section in the main menu:
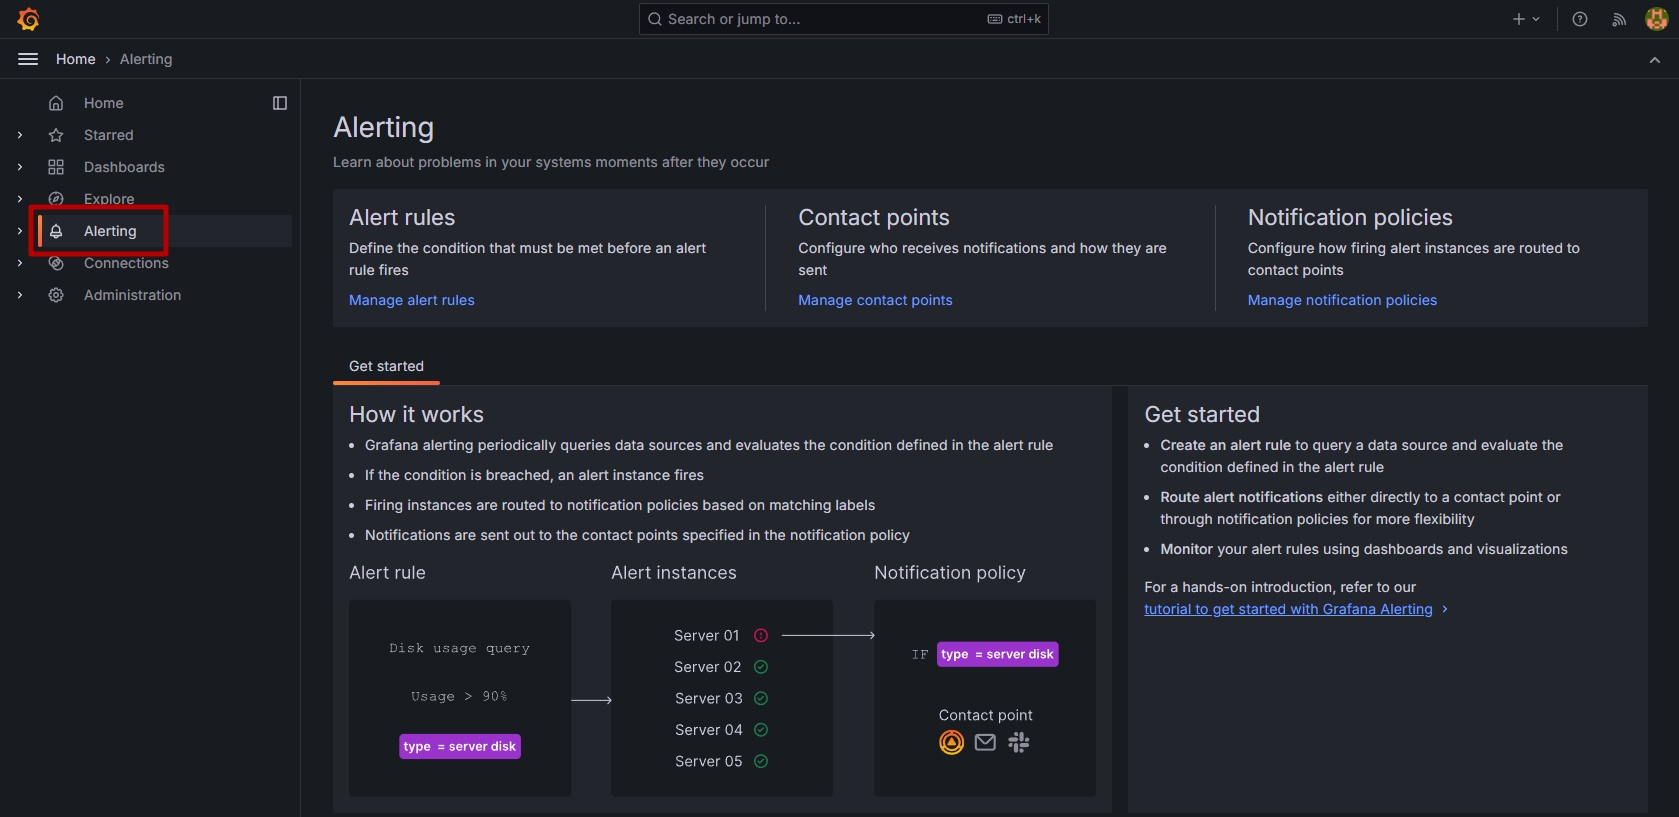
- Alerts notify users when the system experiences a critical load on key resources (e.g., high CPU usage, memory exhaustion, or disk space limitations).
- Alerts are configurable to notify users of potential issues in advance, ensuring timely intervention.